Here is an example – examine the code – it really is quite simple and frankly visuals are where its at these days!
We can also do the type of thing in another format.
and say in a simple bar chart
Or maybe you would prefer a pie chart


Here is an example – examine the code – it really is quite simple and frankly visuals are where its at these days!
We can also do the type of thing in another format.
and say in a simple bar chart
Or maybe you would prefer a pie chart
Vimeo_Channel_Gallery has called it a day on IsOurPlace – for the time being at least! At the moment we...
Wicklow County Council adopted a Wind Strategy in May 2014. A copy of this wind strategy can be seen...
A public information evening, about the Wind Turbine proposal, for people living in the Small Grant Scheme Area was...
– Up to €5,000 available, closing date for applications is 12 noon on Friday, 31st July 2026 Notification for...
Notification for this latest Small Grant Scheme has just been published on the Wicklow County Council Website, pg...
Example of a Ted Talk Playlist on Climate Change A Collection of videos from Ted on Climate Change Example...
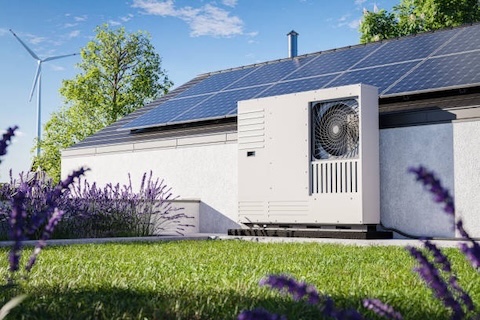
Please take the time to visit a nearly zero energy or low energy building in Wicklow or elsewhere in...
 Ballynagran Energy Plus and The Owner - All Rights Reserved.


Recent Comments